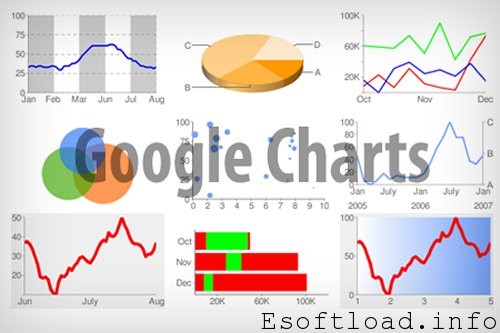
The Google really knows innovate, And every day invents something different – and usually very practical and easy to use. Based on this principle, I recently had contact with a great tool for development of graphics – is the focus of these graphs for publication on websites or blogs, but it is possible to generate the graph, click it and save the hard drive.
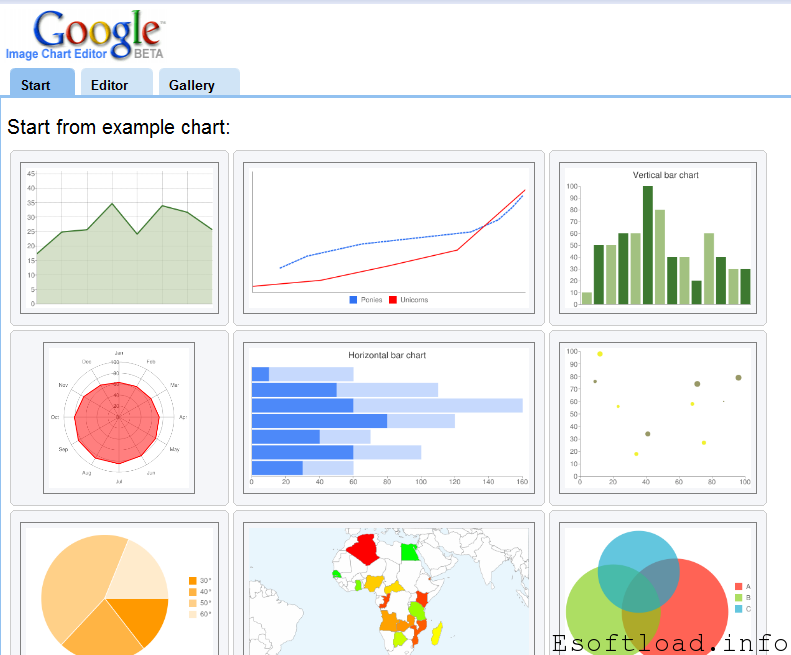
First, you visit Google chat editor
At the top of the page there are 3 tabs:
- Start (start – home)
- Editor
- Galery (gallery)
To start a graphic, just select one of the various graph from the list. To illustrate the operation, let’s make a pie chart.
By clicking on the picture of the pie chart, options will appear as shown below:
For this graph edit the options as follows:
- Options for pie chart: 3D;
- Orientation (angle in radians): 0;
- Title: Title to be given to the graph;
- Size: do not change the values;
- Date set – values: values that represent each slice of pizza;
- Date set – legend: legend for the previous values;
- Date set – label: value that contains the text to display, connected to each pie slice.
Pie chart is standard:
There are many options for configuring the graph, so try, do some tests, and as you know, work with this new tool will be very easy.
Other options
If you want to save the graphic made for subsequent use in a report in Word, for example, simply click your right mouse button on the chart drawn up and “save as”.
You can also send the link of the graph by e-mail by selecting the code for the option “Paste link in email or IM.” By clicking the link in the email you received, the graph will open in the browser in full size.
You can also directly enter the chart within a blog or website by copying the code contained in the “Paste HTML to embed in website”.
If you want to get the HTML code to generate the graph, simply click the “Embed with visualization API.”
These tips were focused on the pie chart. However, all graphs are configurable – use them as your needs!
Share, what did you think of this new tool?


Pretty nice and easy … Thanks for the share 🙂
Cool!! this can be used to create infographics!
yeah this can be used to create infographics, analytic projects n many other project works.
it didn’t knew about google charts. nice share
Nice one Isha,I also saw that this post in first page in Google India.
It is a great idea for the new users to get the Google help for creating graphs.,